
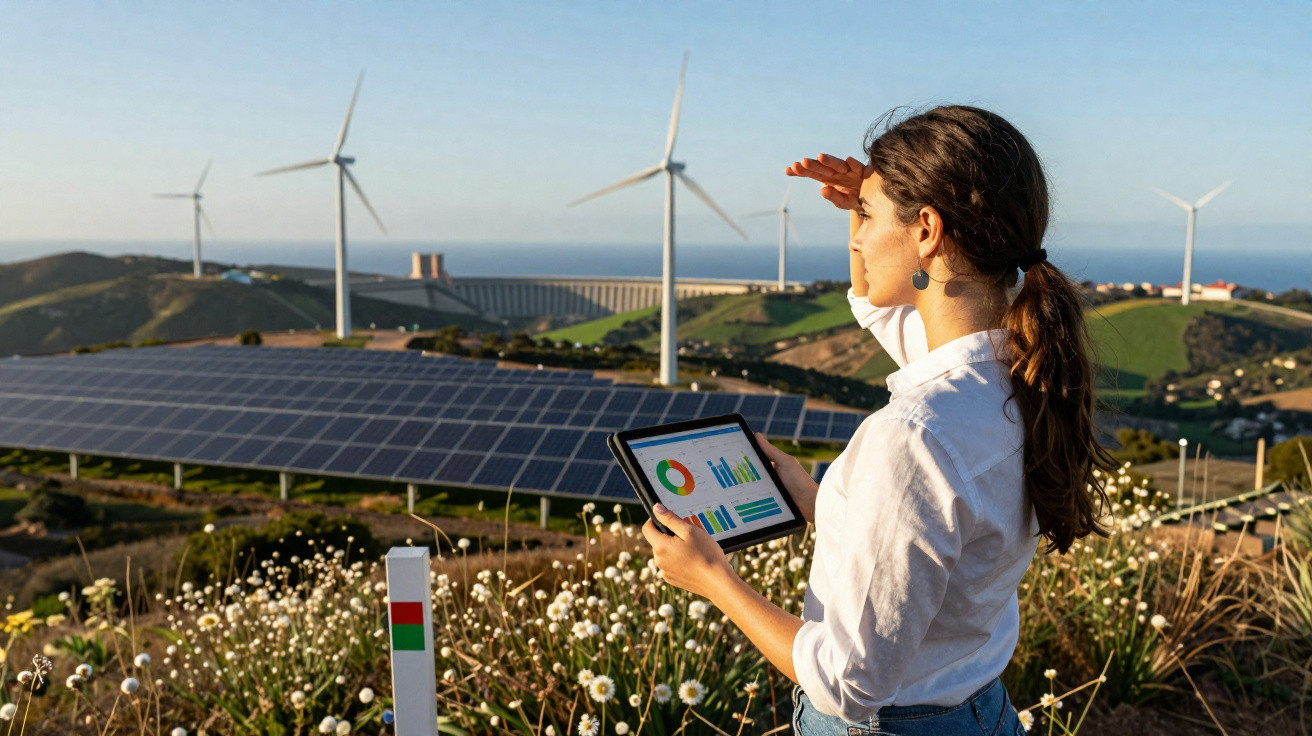
Fresh figures from Portugal’s grid operator point to a pivotal moment for clean electricity. The power mix changed rapidly, with implications that matter to investors, planners and households alike.
Portugal’s understated advantage over Germany
National system figures show that renewable sources met 71% of Portugal’s electricity consumption in 2024. Germany, Europe’s industrial powerhouse, also progressed quickly but did not reach this level. Portugal’s performance rested on a diverse foundation, with hydropower, wind, solar and biomass either increasing or remaining robust.
Portugal posted a 71% renewable electricity share in 2024, led by hydro at 28% and wind at 27%, with solar at 10% and biomass at 6%.
The generation volumes behind that percentage are equally significant. Renewable output totalled 36.7 TWh in 2024, indicating overall electricity demand of roughly 51.7 TWh. The table combines each source’s share with its estimated generation to show the scale involved.
| Source | Share of consumption | Approx. output (TWh) |
|---|---|---|
| Hydropower | 28% | ~14.5 |
| Wind | 27% | ~14.0 |
| Solar PV | 10% | ~5.2 |
| Biomass | 6% | ~3.1 |
Solar’s breakout year
Solar recorded the sharpest rise, with output increasing 37% year on year as Portugal brought online utility-scale parks alongside a continuing flow of rooftop installations. Cheaper modules, shorter construction periods and unambiguous auction signals all contributed. During midday periods, solar generation frequently displaced gas-fired plants in the merit order. Curtailment remained limited because of interconnections and flexible hydropower.
Hydropower roars back
A better hydrological year and effective dispatch lifted hydro generation by 24%. Reservoir operators used stored water to smooth fluctuations in wind and solar output, while pumped storage provided further flexibility by absorbing off-peak excess generation. This recovery differs markedly from drought-affected years, when hydro’s buffer weakened and imports increased. Water availability remains a concern, however, and operators continue to monitor seasonal forecasts closely.
Wind holds firm
Winter storms and coastal winds enabled wind power to provide a dependable, almost baseload-like foundation. Repowering turbines increased output without enlarging their physical footprint. Grid improvements also cut curtailment during especially windy nights. Offshore wind remains part of the longer-term plan, with seabed planning becoming clearer, although the bulk of gains to date has come from onshore fleets.
Gas falls to a 21-year low
Fossil-fuel generation accounted for only 10% of electricity consumption in 2024. Gas use for power generation dropped 17%, reaching its lowest point since 2003. LNG cargoes nevertheless remained important for energy security. System records show that supplies came chiefly from Nigeria at 53% and the United States at 41%. Reduced gas-fired generation lowered carbon intensity and eased wholesale prices during wet and windy weeks.
Gas consumption for electricity fell 17% in 2024, hitting its lowest level since 2003 as renewables pushed into peak hours.
Reasons behind Portugal’s renewable surge
- Stable policy: recurring auctions, financeable contracts and transparent grid rules.
- Hydro flexibility: reservoirs and pumped storage that balance solar highs and wind surges.
- Quicker permitting: reduced paperwork for repowering projects and medium-sized solar schemes.
- Interconnection: extensive trading with Spain helps maintain hour-by-hour balance.
- Rooftop growth: self-consumption arrangements increase daytime supply and reduce demand.
Implications for bills, grids and neighbours
Greater volumes of zero-marginal-cost electricity generally depress prices during windy or rainy periods. While this benefits consumers, it also creates more volatility. Portugal’s grid managed wider intraday movements through hydropower, batteries and cross-border exchanges with Spain’s market. Bottlenecks still emerge on stormy nights, but storage developments are intended to capture these low-price periods and sell power again during the evening peak.
Industrial purchasers have more options as a result. Businesses can enter power purchase agreements linked to local wind or solar projects. Data centres and electro-intensive facilities can move part of their demand to periods when prices fall. Accurate forecasting is essential for the grid operator, making improved weather models and plant telemetry central to daily operations.
The principal risk lies with water availability. A dry year could reduce hydropower output and require gas to return as backup generation. Policy measures protect demand through energy-efficiency improvements, heat pumps and smarter tariffs. The Iberian market provides an additional cushion, as Spain’s generation mix can fill shortfalls and take surplus electricity when conditions change.
Europe’s wider picture
Across the EU, renewables exceeded half of electricity generation during the first half of 2024. Wind and solar supplied about 30% of the mix, while fossil fuels fell to around 27% amid softer demand and strong renewable output. Europe is set to add substantial wind capacity through 2027, with more than 100 GW planned. Solar continues to grow at both utility and rooftop scale.
Germany installed a substantial number of solar panels and wind turbines in 2024. Its renewable share nevertheless remains below Portugal’s because German electricity demand is far larger and more industrialised. Portugal benefited from a smaller grid, plentiful hydropower and rapid solar rollout, magnifying the annual percentage movement.
What to watch in 2025
- Hybrid sites: solar projects built alongside wind or hydro facilities to use shared grid connections.
- Battery pipelines: four-hour systems targeting evening peaks and balancing day-ahead forecasts.
- Floating PV on reservoirs: reduced land use and closer integration with hydropower assets.
- Green hydrogen pilots: off-peak consumption in locations where pipelines and ports already exist.
- EV charging load: managed charging that makes electric vehicles a flexible source of demand.
Two practical notes for readers
Capacity factor is often misunderstood. It describes average output over a given period as a proportion of the maximum output theoretically possible. Portugal’s wind farms generally operate at around 30% to 40% over a year. Solar performs closer to 20% to 25%, depending on site location and panel tilt. These measures influence revenue and grid planning because they indicate when electricity is actually produced.
A simple household example illustrates the point. In favourable conditions, a 5 kW rooftop system in Lisbon may generate about 7,500 kWh annually. A typical flat consumes 2,500 to 3,000 kWh. Under self-consumption rules and with a smart inverter, a household could meet most of its daytime demand and sell any remaining electricity. Adding a small battery moves late-afternoon solar production into the evening meal period. Payback varies according to the tariff, roof pitch and equipment cost, but the economics are increasingly moving towards installation.






Comments
No comments yet. Be the first to comment!
Leave a Comment